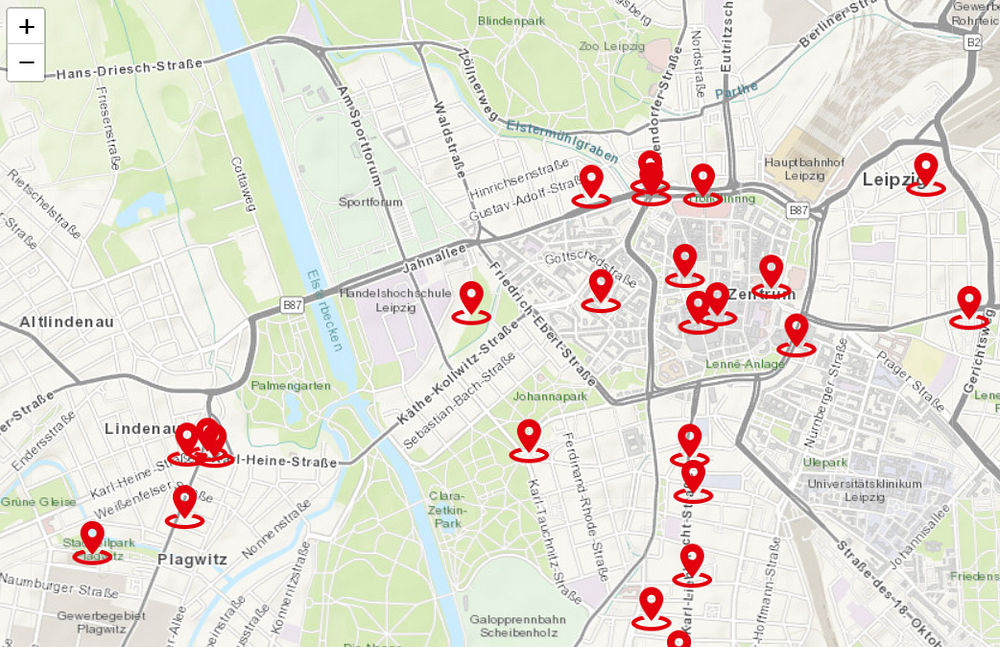


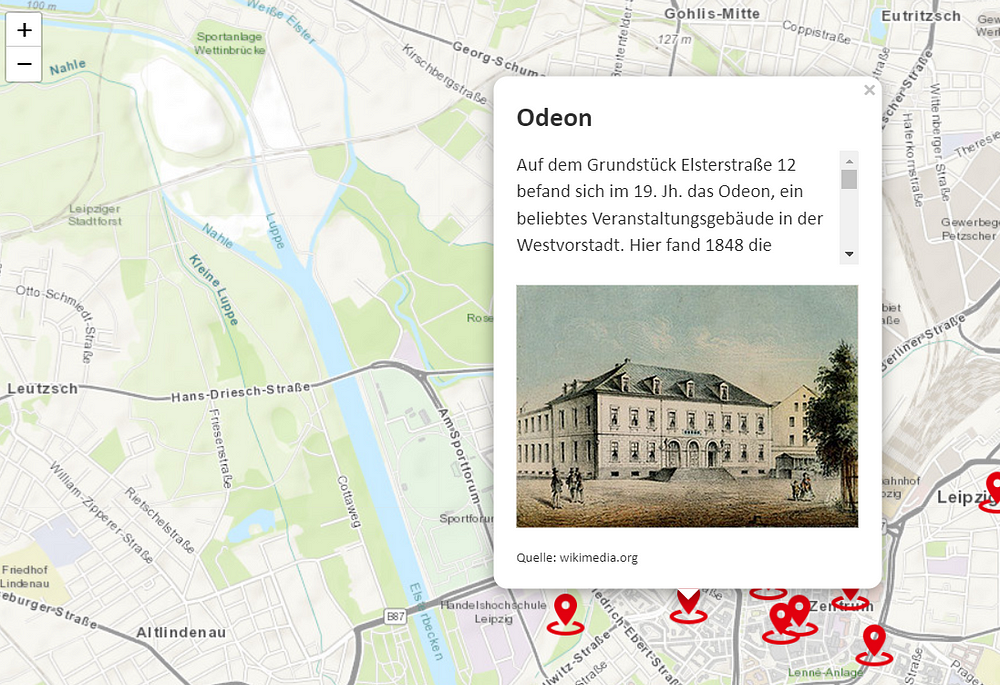
A friend asked me to create an interactive map for her. The task was to show places of the democratic movement in Leipzig (Germany) that could later be hosted on a website (Don’t worry, you don’t need to know German to follow along). The map provides information about where these places are (of course), but should also provide additional information (descriptive text and images) on click.
I used R’s Shiny to create this web application because it is a powerful tool that offers great extensions and flexibility. It is also easy to use and allows you to add HTML code if needed. And if you get stuck, you can easily get help online.
Let me walk you through it.
For the web application, you need to program the frontend (the interface the user will see and interact with) and the backend (which defines the functionality of the application).
Before we start, let me give you a quick overview of the data. The dataset consists of the following columns:
- Name: Name of the place
- Latitude: Latitude of the place
- Longitude: Longitude of the place
- Description: Descriptive text about the place
- Picture: URL to an online picture of the place or path to the picture in my local folder
- Source: Provider of the picture
- Source_ind: Indicator whether the source is public or private
The interface for the interactive map is simple and contains only one main output (the map itself). As you can see, the code specifies the headline of the web application and the leafletOutput that displays the map.
#--------------------------------------------------
# load libraries

library(shiny)
library(htmltools)
library(shinyjs)
library(leaflet) # for generating the map
library(dplyr)  # for data processing
library(fresh)
library(glue)
library(sf) # for handling spatial data

#--------------------------------------------------
# start front end
ui <- shinyUI(
    fluidPage(
        tags$head(HTML("<title>Orte der Sozialdemokratie</title>")),
        leafletOutput("map", height = "100vh")
    )
)
The backend has a few more components. First, we’re reading the data sheet and transforming it into spatial data.
#--------------------------------------------------
    # read data

    dta <- openxlsx::read.xlsx(
        "raw_data.xlsx"
    )

    # make it spatial
    poi <- sf::st_as_sf(
        dta,
        coords = c("longitude", "latitude"),
        crs = 4326,
        remove = FALSE
    )
Then I do a simple data adjustment that replaces the image URL with a local path in the case of a private source.
#--------------------------------------------------
    # replace picture link with path if picture is privat

    poi <- poi |>
        dplyr::mutate(
            picture = dplyr::case_when(
                source_ind == "privat" ~ paste0(name, ".JPG"),
                TRUE ~ picture
            )
        )
The following coding block adds custom icons to mark the locations. You could choose any suitable image that works for you. Just make sure you have added it to your local drive and that it has the appropriate resolution.
#--------------------------------------------------
    # define marker icons
    pointerIcon <- makeIcon(
        iconUrl = "pointer_large.png",
        iconWidth = 40,
        iconHeight = 40
    )
The block below defines the pop-up window for each marker. It defines the name of the place, the descriptive text, the image, and the source. I also add some standard HTML formatting commands, including the ability to scroll the descriptive text. This helps to ensure readability on smaller screens.
#--------------------------------------------------
    # define label text for pop-ups
    label_text <- glue(
        "<h3 style = \"font-family:Calibri, sans-serif;\"><b>{poi$name}</b></h3>",
        "<p style = \"font-family:Calibri, sans-serif; font-size:140%; overflow-y:scroll; height:100px\">{poi$description}</p>",
        "<img src={poi$picture} width = 300px height = auto>",
        "<p style = \"font-family:Calibri, sans-serif;font-size:100%\">{poi$source}</p>"
    )
The last step is to assemble the map. leaflet() initializes the map environment. addProviderTiles() adds the background map and defines its style. There is a good overview of available layouts here. With setView(), you can set the center of the map at startup. Finally, I add the point locations, including the icons and the popup window with the descriptive text and image.
#--------------------------------------------------
    # create map

    output$map <- renderLeaflet({
        leaflet() |>
            addProviderTiles(
                providers$Esri.WorldTopoMap,
                options = providerTileOptions(noWrap = TRUE)
            ) |>
            setView(12.39071794006535, 51.345641678880185, zoom = 13) |>
            addMarkers(
                data = poi,
                icon = pointerIcon,
                popup = label_text
            )
    })
Thank you for reading!
The code for the Shiny app can be found on my GitHub. You can read the story also on Medium. Feel free to reach out on LinkedIn.
Suggestions or questions? Leave a comment or contact me.
Leave a Reply