My Portfolio.
Explore a selection of data-driven projects where technology meets insight — built to solve real problems and deliver impact
Cyclistic Case Study – Analyzing Bike-Share Usage with Google Data Analytics
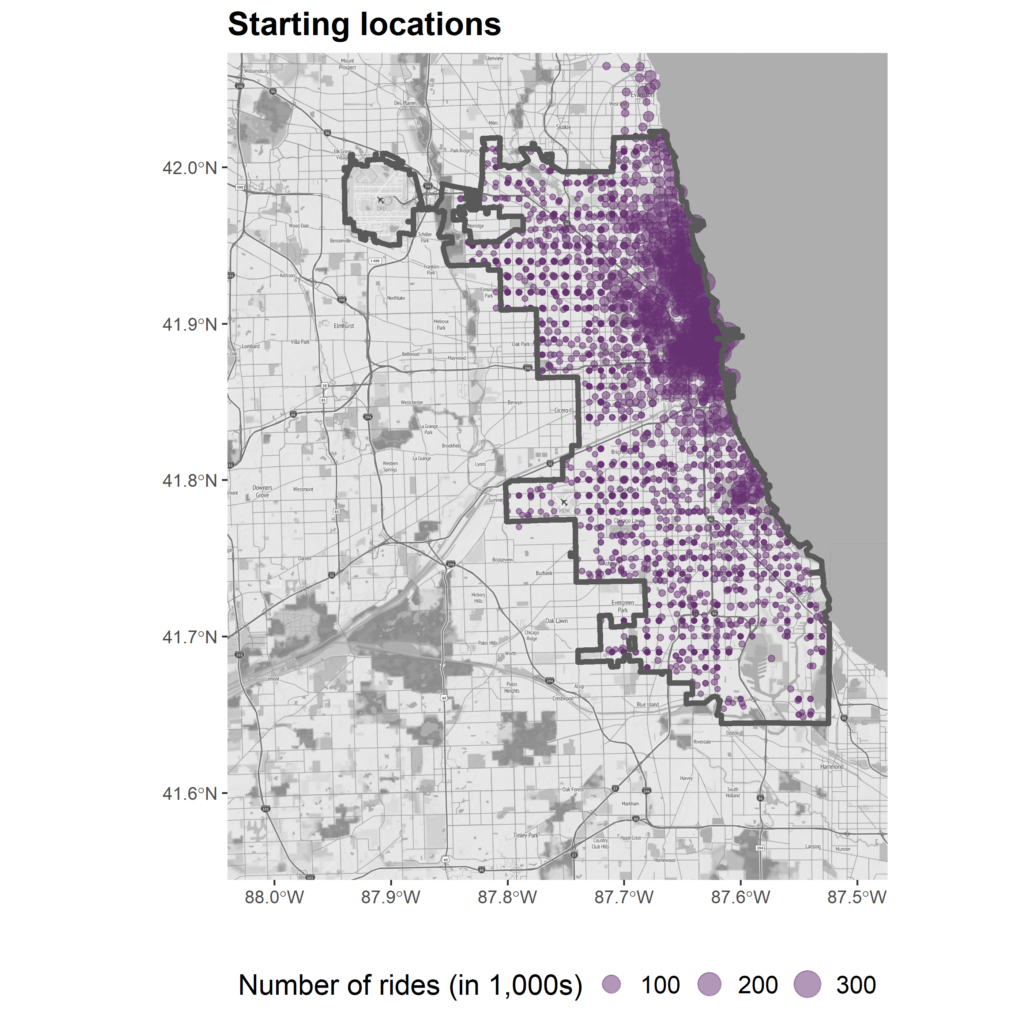
As the capstone for the Google Data Analytics Certificate, this project investigates how annual members and casual riders use Chicago’s Cyclistic bike-share service differently. Using real-world trip data from 2020–2024, the analysis covers usage patterns over time, trip distances, and station popularity. The insights inform business decisions around marketing, service design, and rider engagement strategies.
keywords:
Cyclistic
User Behavior Analysis
Bike-Share Data
Data-Driven Insights
Urban Mobility
R Programming
RWI-GEO-REDC: Commercial Real Estate Data for Germany
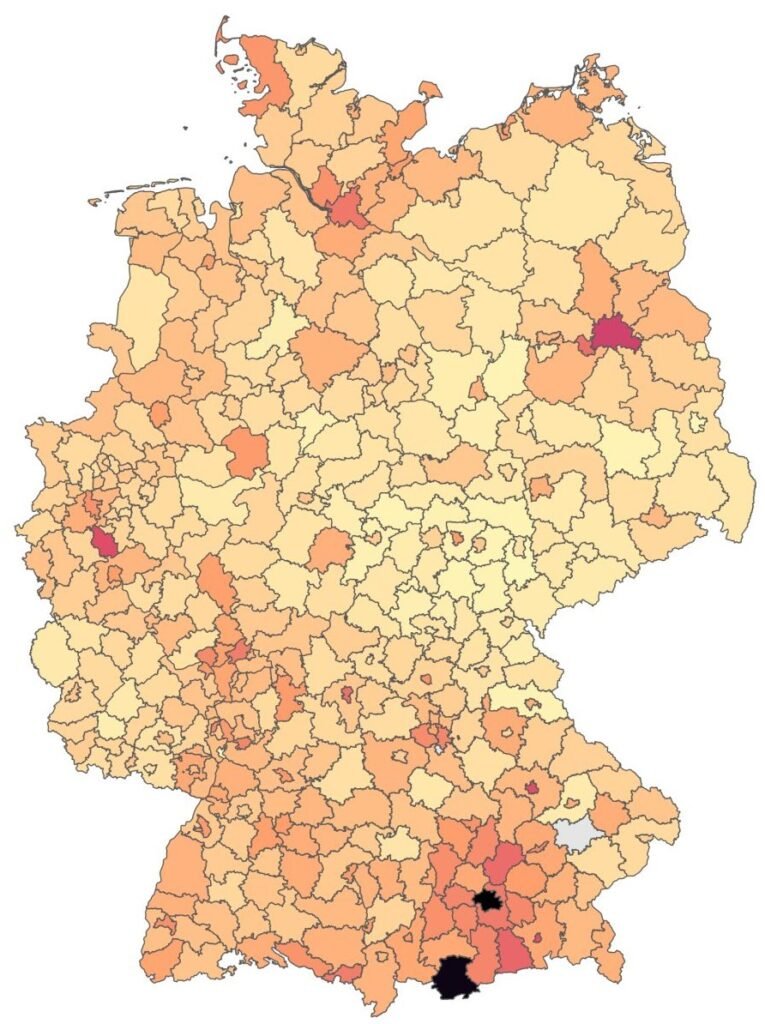
Built a scalable, first-of-its-kind dataset covering commercial real estate assets across Germany. This project integrates heterogeneous public data sources to provide granular insights into asset types, locations, and structural characteristics—enabling data-driven investment analysis, market segmentation, and urban planning at the national level. The dataset supports thousands of external users and is actively used by public institutions and researchers.
keywords:
Scalable Dataset Design
Open Data Integration
ETL Pipelines
Geospatial Data Processing
Data Engineering
R Programming
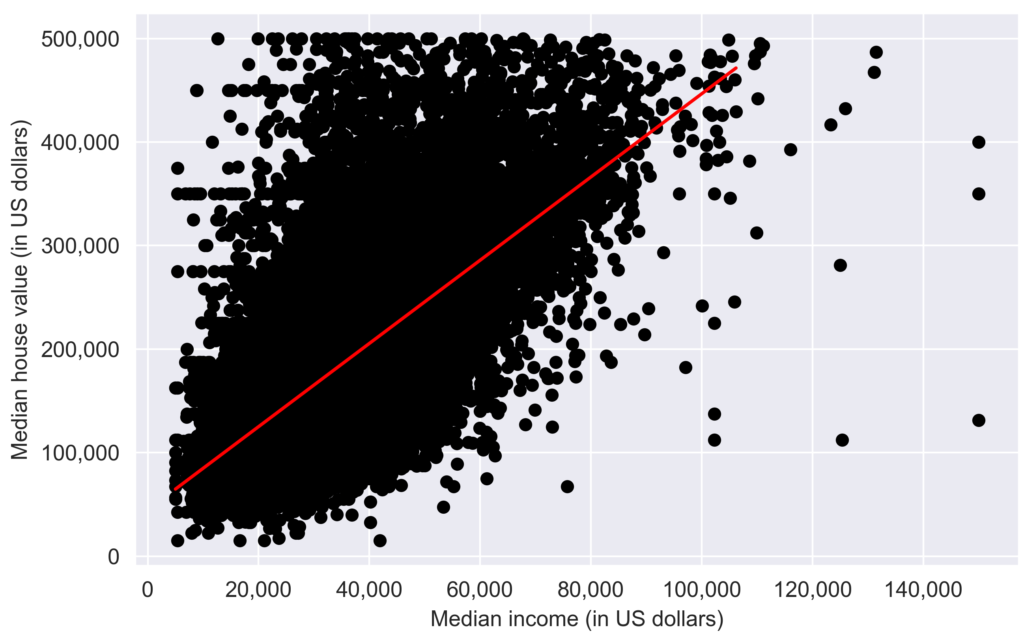
RWI-GEO-REDX: A Housing Price Index for Germany
RWI-GEO-REDX delivers a robust, scalable framework for generating spatiotemporal real estate price indices across Germany, based on microdata from ImmoScout24. Using hedonic regression techniques, the project constructs indices across multiple spatial resolutions (1×1 km grid, municipalities, districts, and labor market regions) and temporal scopes (annual and quarterly). The indices cover apartment rents, apartment sales, and house sales—individually and in a unified format—enabling fine-grained analysis of housing markets.
keywords:
Hedonic Regression
Housing Market Analytics
High-Resolution Real Estate Indices
Geospatial Microdata
Open Economic Data
R Programming
The Great Regression – Exploration of Regression Methods
This project explores modern regression techniques through hands-on Python implementations. It combines theoretical foundations with real-world applications across a series of evolving posts. Designed for continuous learning and practical insight, the project showcases scalable, interpretable, and business-relevant models in data science.
keywords:
Regression Modeling
Machine Learning
Python Programming
Predictive Analytics
Model Interpretation
Technical Blogging
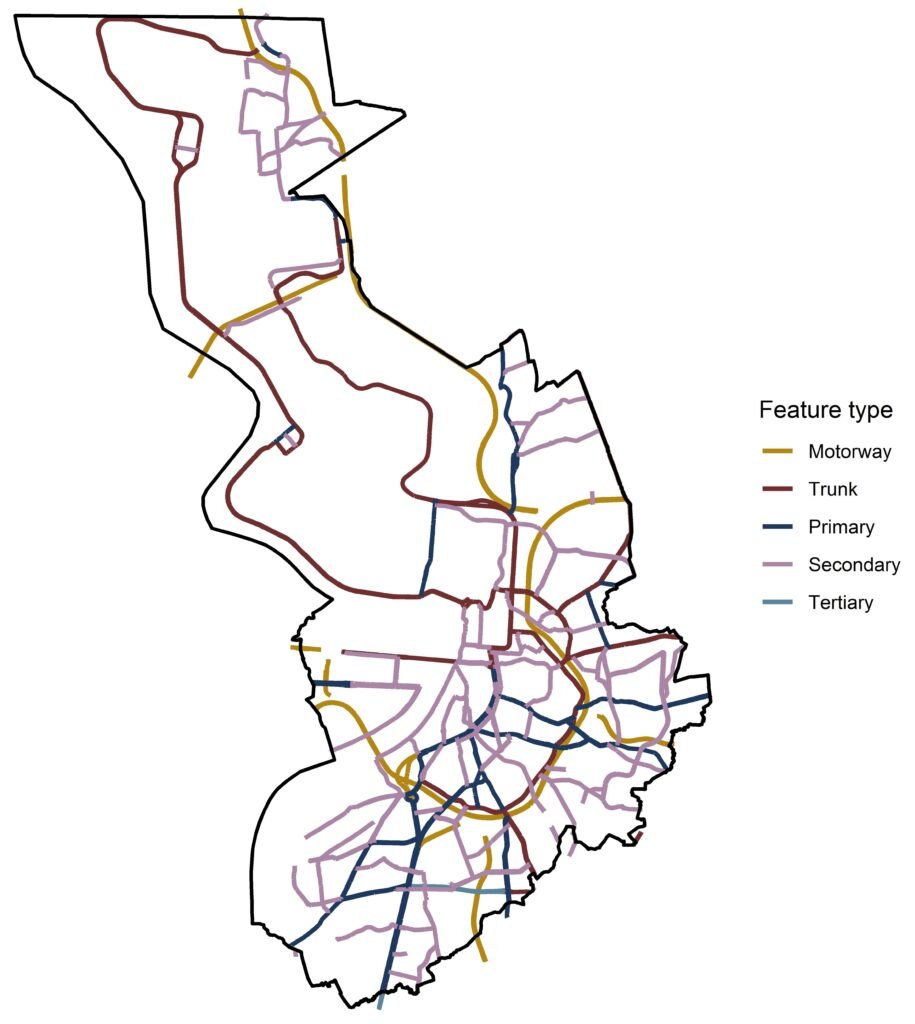
Extraction of Banks and ATMs from OSM

The OSM-Banks project extracts and processes geospatial point data on banks and ATMs across Germany using OpenStreetMap (OSM). Leveraging amenity tags (bank, atm), the tool parses and cleans OSM snapshots from 2014, 2018, and 2022, enabling longitudinal spatial analysis of financial service infrastructure. The processed data can support urban planning, financial inclusion studies, or infrastructure monitoring applications.
keywords:
OpenStreetMap (OSM)
Geospatial Data Extraction
Financial Infrastructure
API Accessing
Python Programming
Longitudinal Spatial Analysis
Identifying Comparable Cities in Europe
This project implements a practical matching strategy to identify comparable European cities for evaluating the effects of Nature-based Solutions (NbS). Given the limitations of randomized control trials in urban policy research, the approach builds matching control groups for project cities (CiPeLs) like Munich and Leuven by analyzing socioeconomic and environmental indicators. The resulting matches enable more rigorous impact assessments of urban sustainability initiatives.
keywords:
Urban Policy Evaluation
Nature-based Solutions (NbS)
City Matching
Impact Assessment
Comparative Urban Analysis
European-Scale
Interactive Mapping of Places in Leipzig
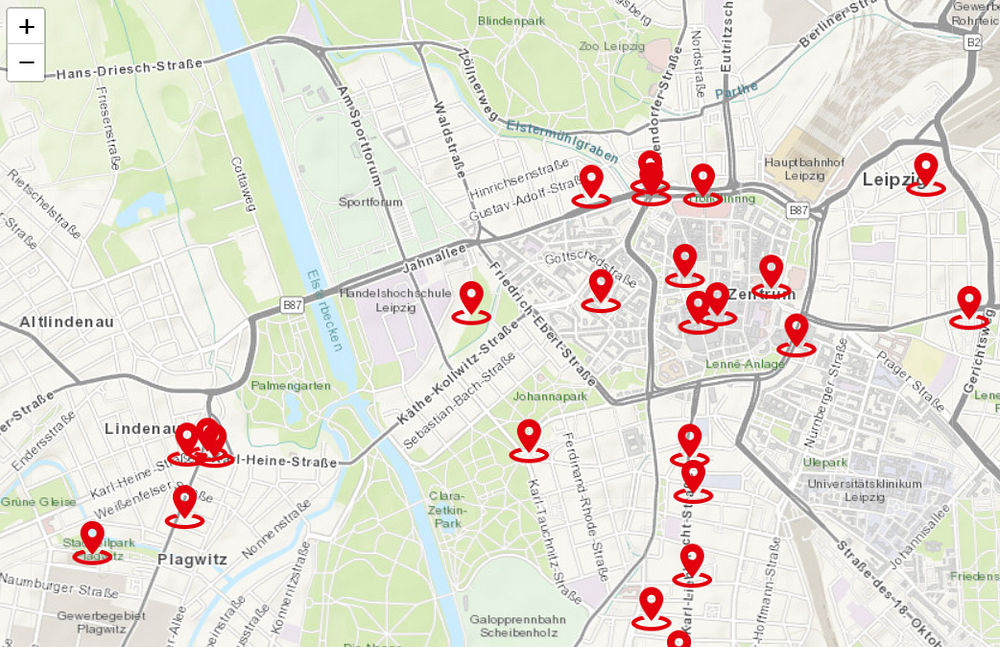
This interactive Shiny app visualizes key locations tied to the democratic movement in Leipzig, Germany. Built with R, the project highlights historically significant places in a user-friendly web interface, blending geospatial data with public history. It serves as a tool for civic education and engagement by making political history spatially accessible.
keywords:
Interactive Mapping
R Shiny Application
Geospatial Visualization
Public History
Democratic Movement
Leipzig
Noise and Air Pollution in European Cities
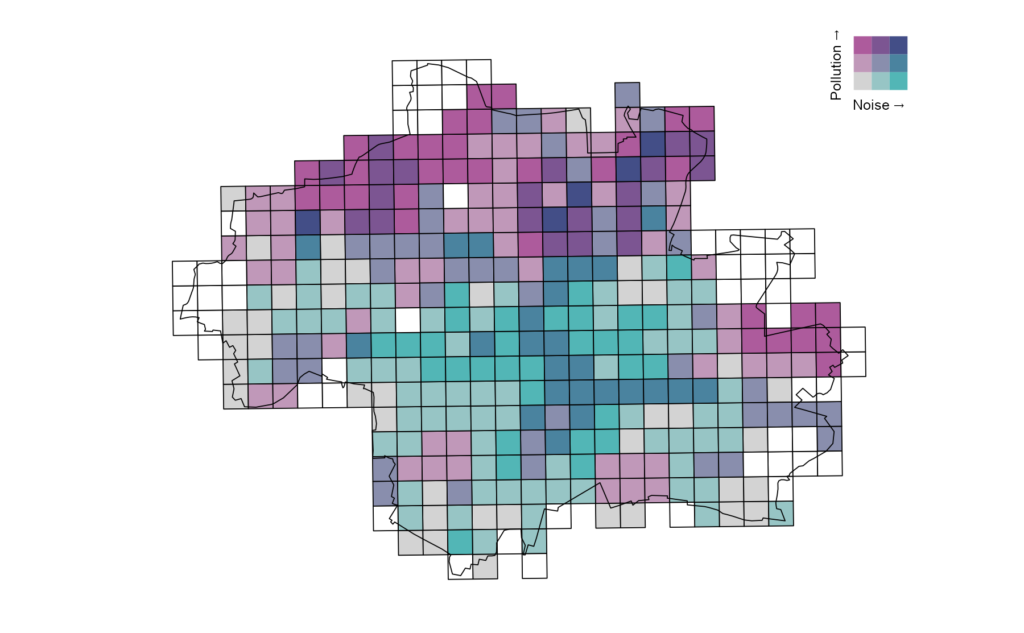
This project maps and analyzes high-resolution spatial data on environmental noise and air pollution across European cities. By integrating public datasets, it highlights spatial patterns of pollution exposure and supports research into the health and well-being impacts of urban noise and air quality. The project is a tool for data-driven environmental assessment, policy analysis, and academic exploration.
keywords:
Environmental Data
Noise Pollution
Geospatial Visualization
Geospatial Analysis
Air Quality
R Programming
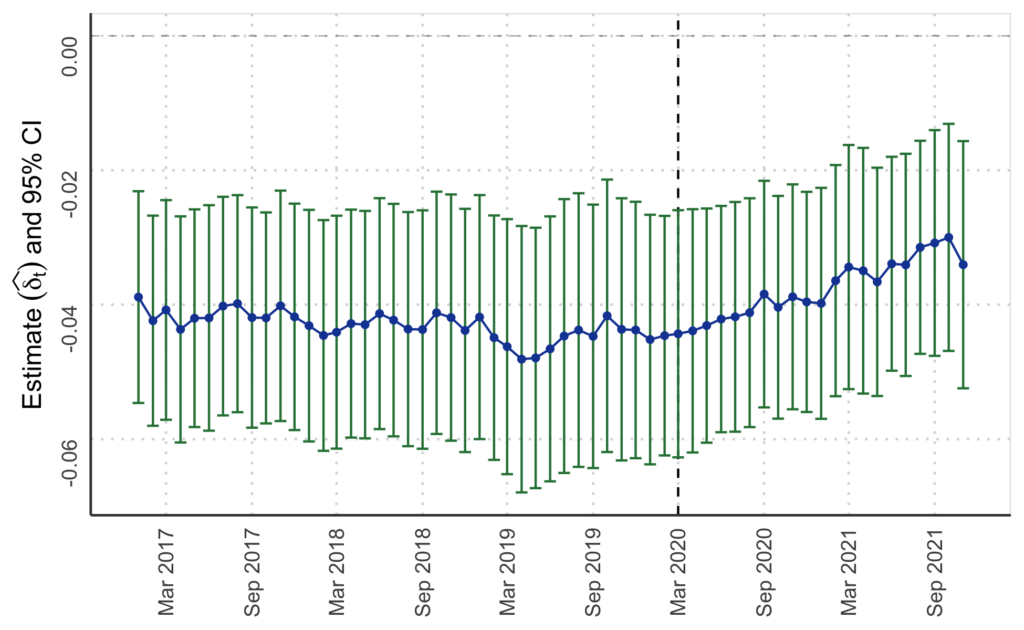
Replication Code – Housing Prices, Airport Noise and an Unforseeable Event of Silence
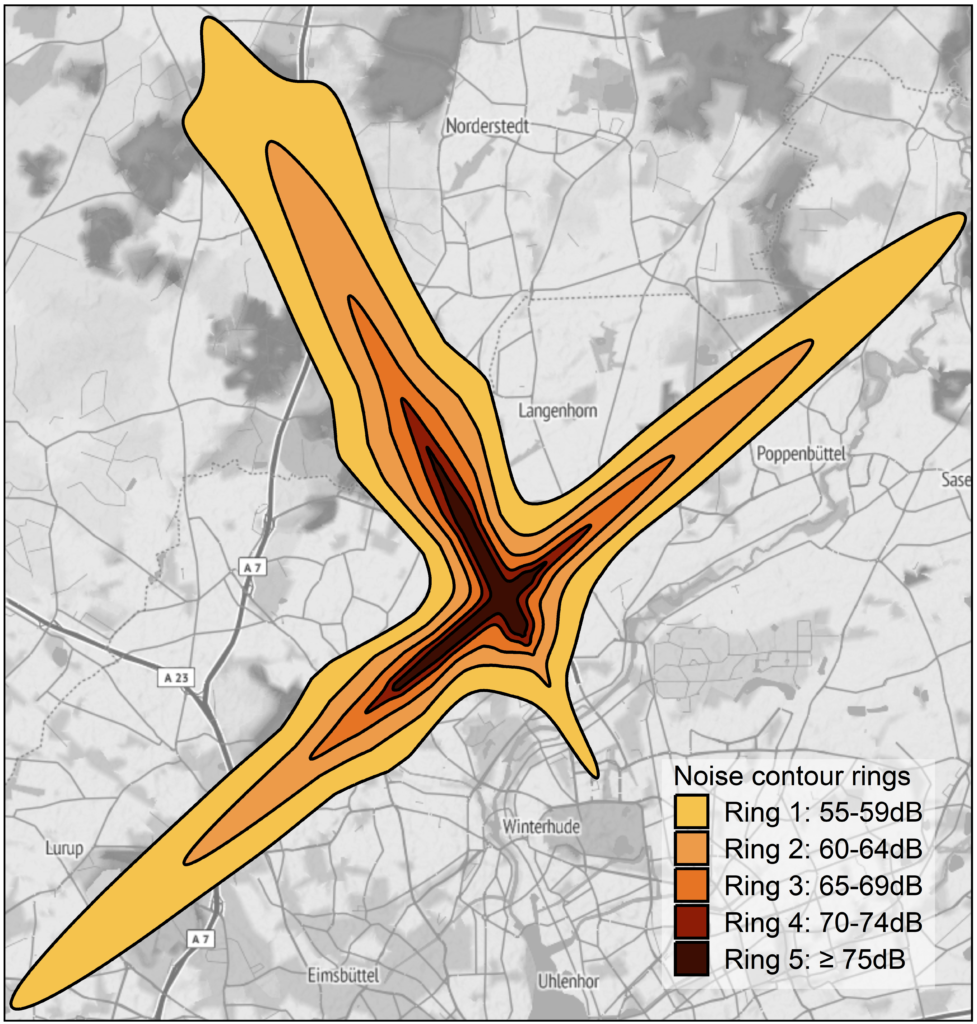
Replication Code – Housing Prices, Airport Noise and an Replication Code for my research paper “Housing Prices, Airport Noise and an Unforseeable Event of Silence” (joint work with P. Breidenbach). Published in Journal of Housing Economics.
keywords:
Housing Prices
Airport Noise
Natural Experiment
Difference-in-Differences
COVID-19 Shock
Causal Inference
Replication Code – The Impact of Germany’s Railroad Noise Protection Act on House Values
Replication Code for my research project “The Impact of Germany’s Railroad Noise Protection Act on House Values“. Published in Journal of Real Estate Research.
keywords:
Railroad Noise
Housing Prices
Environmental Policy Impact
Noise Pollution
Difference-in-Differences
Germany Real Estate
Replication Code – The Impact of Covid-19 on Real Estate Markets in Germany
Replication Code for my research project “The Impact of Covid-19 on Real Estate Markets in Germany” (joint work with E. Beze). Published in German Economic Review.
keywords:
Real Estate Markets
COVID-19 Impact
Donut Effect
Urban vs Suburban Housing
Germany Housing Market
Rent and Price Dynamics
RWI-GEO-RED Extension: Mannheim & Wuppertal

This project delivers a tailored extension of the RWI-GEO-RED housing dataset, incorporating additional spatial variables for the cities of Mannheim and Wuppertal. Designed for the Wuppertal Institute for Climate, Environment, and Energy, the dataset enhancement includes district-level information and the classification of historic buildings, enabling more targeted urban and environmental analysis.
keywords:
Stakeholder-Focused Research
Spatial Housing Data
RWI-GEO-RED
Urban Analysis
Custom Data Integration
Historic Building Mapping
Pass-Through Calculator (Tkinter App)
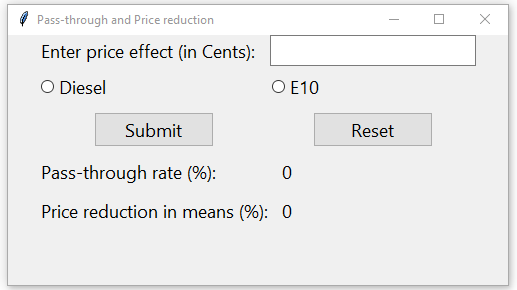
A standalone desktop application built with Python and Tkinter to estimate cost pass-through rates using reduced-form econometric models.
keywords:
Pass-Through Estimation
Reduced-Form Econometrics
Cost Shock Transmission
Price-Cost Dynamics
Python Programming
Tkinter